
If you’ve spent any time exploring this blog or doing general research on infographic marketing, you’re probably already aware of just how powerful infographics can be. You may remember reading that infographics are a useful form of communication because 90% of the information transmitted to the human brain is visual, and visuals are processed 60,000 times faster than text. Or maybe you’ve heard about just what a boon infographics are to social media engagement and come across the study that found images increase Twitter retweets by up to 150%.
You know that infographics are valuable and can yield tangible results for your business, but knowing that is one thing and actually producing infographics is another, especially if you’re working on a tight budget. One question that I regularly get asked is, “How can I create infographics for free?”
The good news is that while many business owners choose to work with a graphic designer, you can also easily create your own infographics using one of the many free online template tools, gathering data and writing the copy, and promoting it yourself. I’m going to divide the process of making your own infographic into three parts to make it easier to follow. In this first part, I’ll go over some popular template tools. In the next part, I’ll talk about how to find data for your graphic, and in the final part, I’ll talk about free tools you can use to format and promote your infographic on social media.
8 Free Infographic Template Tools to Try
Canva is one of the best infographic template tools available, offering an easy-to-use interface and hundreds of free design elements. It’s a great tool for both beginners and marketing managers on a budget, since it doesn’t require any graphic design knowledge and allows you to craft professional designs. They do offer premium template or images for a small fee, but even if you choose to take advantage of them, it’s less expensive than hiring even the most budget-friendly designer. You can read my full review of this tool here.

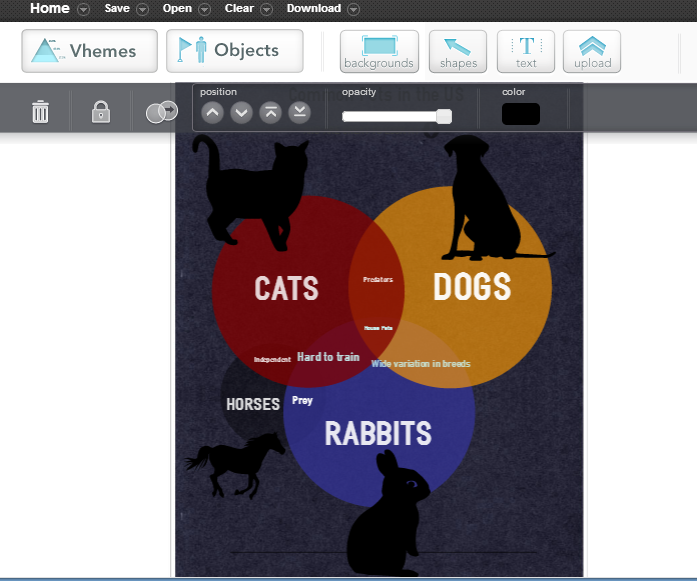
Easel.ly is a good tool for beginners because it’s fairly intuitive, with its drag-and-drop features and easy-to-resize icons and text boxes. You can choose from 15 basic free templates, including Venn Diagrams, flow charts, and US or world map charts, and then you can add your own background, text, arrows, shapes, and icons. You can see an example infographic that I spent just a few minutes working on below.
Piktochart has a customizable editor that lets you do things like upload your own basic images, choose from existing graphics and images, and easily align graphic elements using a grid-lined template. The only real downside is that the free version only comes with three templates; to get access to more, you would have to purchase a pro account for $29 a month.
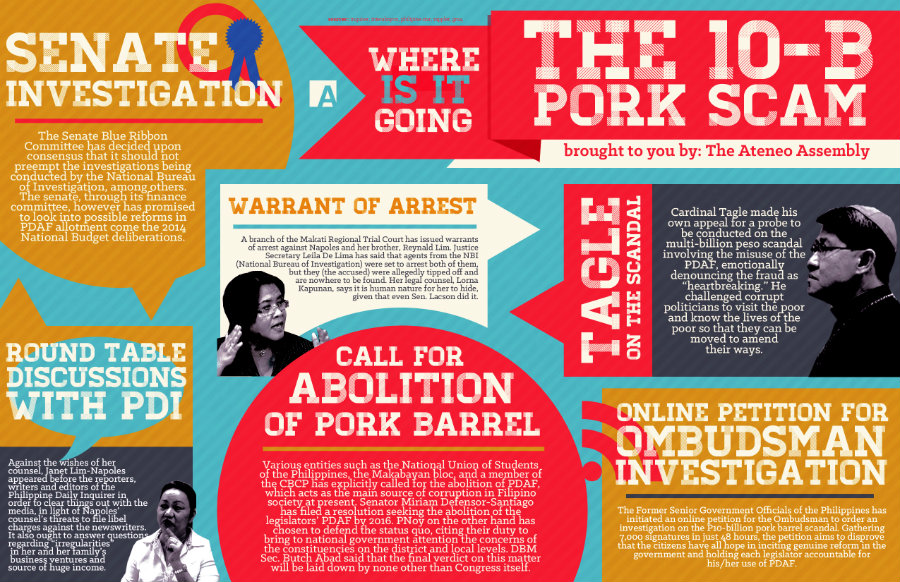
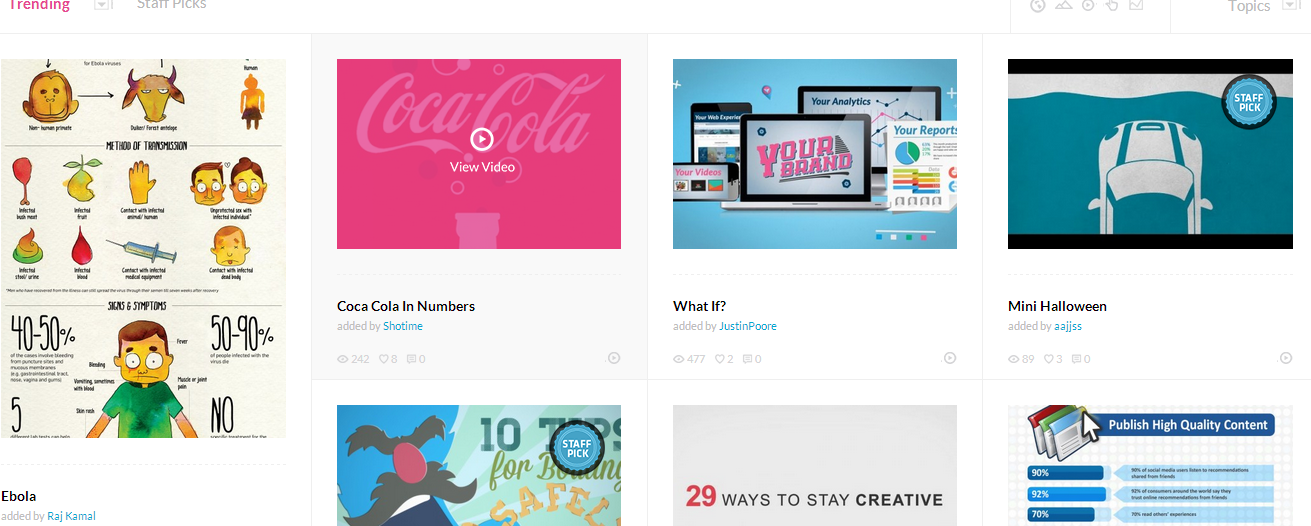
Visual.ly is a popular platform for customizing infographics and has been around since 2011. In addition to templates, they offer professional graphic design services (for a price) that have been used by sites like The Huffington Post, LinkedIn, and Virgin Mobile. Visual.ly also contains a huge database of community infographics, so it’s a great place to go to get some ideas for presentation if you’re stuck.
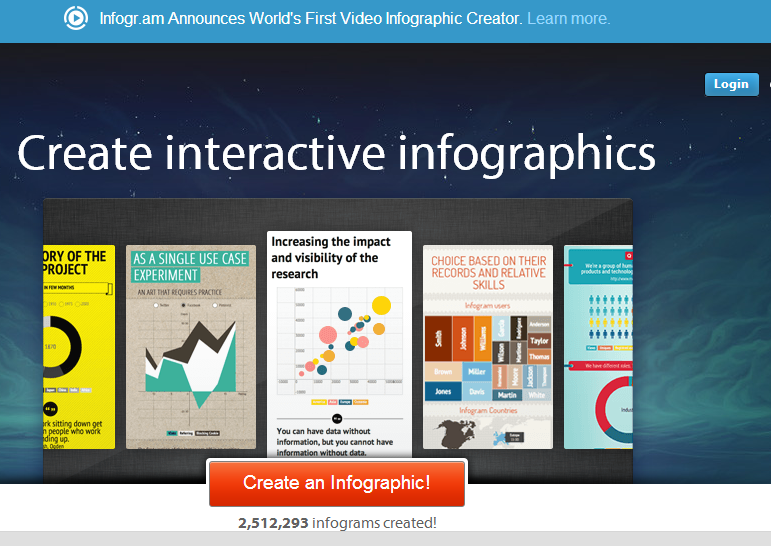
Infogr.am is the tool to use if you want to create interactive or animated infographics for free (although it also allows you to create static infographics). You just enter your data using the Infogr.am spreadsheet or an uploaded Excel file, and Infogr.am will transform it into an infographic.
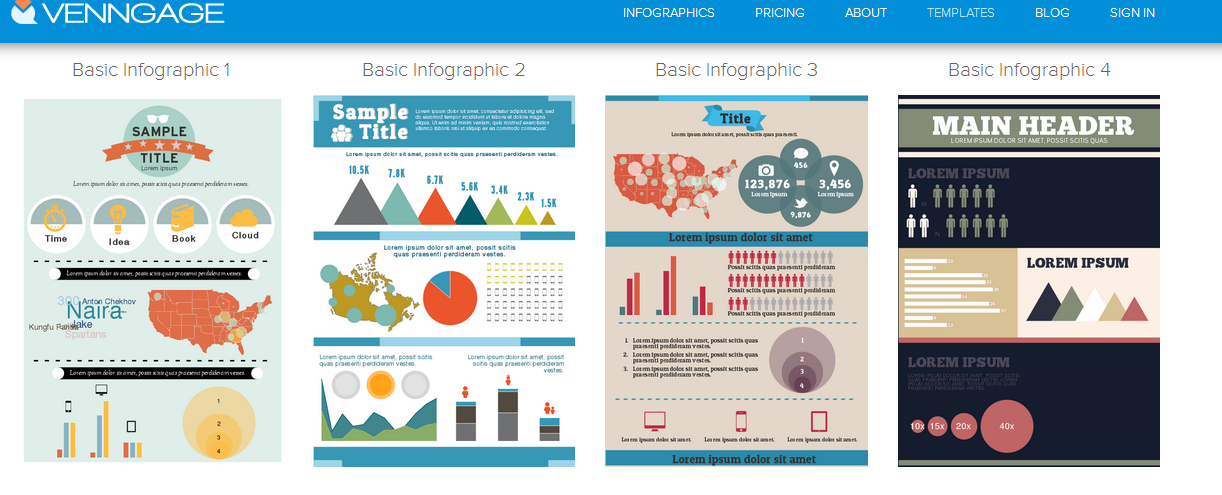
Venngage has a good selection of free templates, but one nice aspect that sets it apart from similar tools is that it allows you to track engagement with your infographic. It also allows you to easily add call-to-action widgets like social media buttons, coupons, and sales.
Dipity. If you’re specifically interested in creating a linear infographic, Dipity is a useful tool. It’s specifically designed to let users organize online content by date and time, and you can add images, videos, audio, website links and more to your customized timeline. This specific type of infographic obviously isn’t going to work for every data set, but it’s a great way to present some information, as in the Internet Memes timeline below.

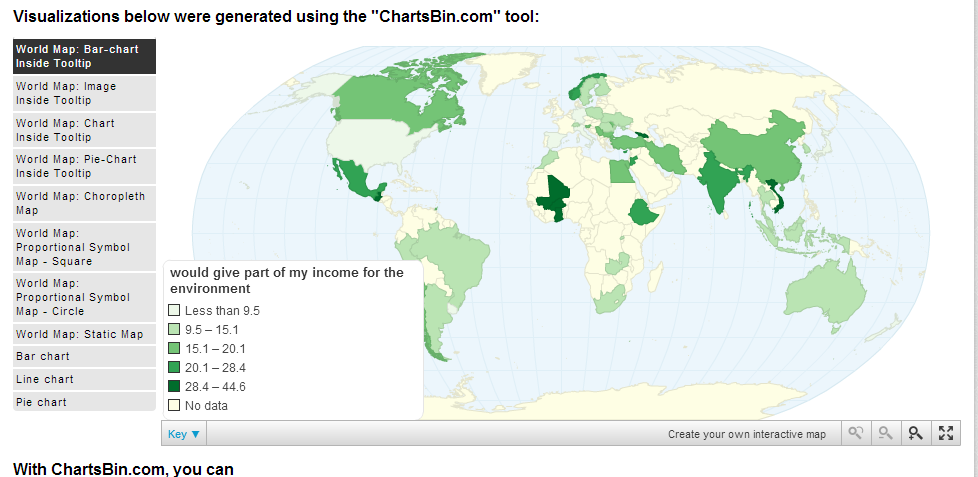
ChartsBin allows you to create interactive infographic maps without having to know any coding. You can embed your map on your site and blog simply by copying and pasting the HTML code. The service is free for now, as long as you register on the site by entering your email.
Making the Most of Templates
While templates can be a great way to make free, professional infographics when you don’t have a lot of design experience, you should take the time to thoroughly customize your graphics so that they look less like templates and more like your own brand. Look for opportunities to upload your own backgrounds and images for a more personal touch, and remember to add calls-to-action, such as social media sharing buttons, when you can.
Now that you’ve learned about several different free infographic templates, your next step will be filling your template with engaging information that web users will want to share. In the next part of this series titled “How to make infographics”, I’ll talk about how to gather data using free and reliable online databases.
Nice Post Juliana