Think about the way you process information offline and online. In the real world, all your senses are available to you; even if you are attending a lecture on an abstract subject, you can look at the speaker’s gestures and facial expression and also listen to their tone of voice to better understand the content they’re sharing. When you’re online, on the other hand, your senses are more limited. You won’t always get as much out of an online transcript of a lecture as you would from actually attending it.
To combat these limitations, many content marketers use infographics to better engage internet users and explain complex ideas. I’ve been discussing different styles of infographics that marketers use in the last four parts of this series, and in this installment, I’m going to look at how marketers use metaphors as visualization tools for infographics.
Metaphor Visualization
As you may remember from your high school English classes, a metaphor is a figure of speech that says one thing is another (e.g. “America is a melting pot”). Metaphors are helpful because they allow you to explain an abstract concept in concrete terms, making it easier to understand. They can also trigger an emotional response. For example, if a hotel places an image of a hot cocoa mug over the word “amenities” on their website, you might start imagining the hotel is cozy, even if you’ve never stayed there.
Content creators often frame their infographics using a metaphor that users will quickly recognize and understand. Here are just a few examples of the ways metaphor visualization is used in infographics.
Metro Map

What is it? Many major cities—such as London and Washington DC—use metro maps to visualize their public transportation system. Different train lines are represented by different color lines generally drawn in the direction that they travel (with north being up).
Best Use: While the metro map is most commonly used in public transportation, it has also become popular in infographics, where it can be used to help explain timelines or complex networks, such as the US Highway numbering system.
Story Template
What is it? A common educational tool, the creative story template visualizes the different components of a story using a metaphorical image (for example, the whole story might be a castle, with a drawbridge representing the beginning, increasingly taller towers representing the rising action, and an exit representing the conclusion).
Best Use: Story templates can be adapted into infographics in which the creator wants to convey a big concept by highlighting its individual components (e.g. showing the factors that led to the 2008 housing crash as different components of a house).
Tree

What is it? Tree metaphors use the primary components of a tree (the roots, trunk, branches, and leaves) to illustrate how different concepts are connected.
Best Use: A family tree is one obvious application for the tree diagram, but this metaphor could be used to explain any concept in which sub-concepts “branch” off a central idea.
Bridge of Negotiation
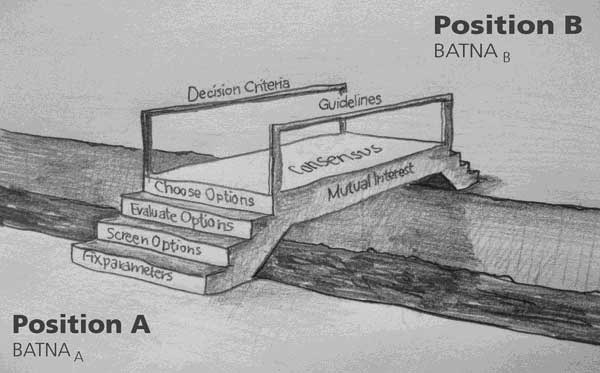
What is it? A bridge of negotiation establishes a compromise between two opposing ideas by depicting the ideas on opposite shores and showing a bridge containing a compromise that connects the two ideas. The bridge might also have steps leading up to it, showing how the compromise was reached.
Best Use: Use a bridge of negotiation when you want to use your infographic to show a solution through compromise, such as the compromise that might be reached to settle a lawsuit out of court.
Funnel
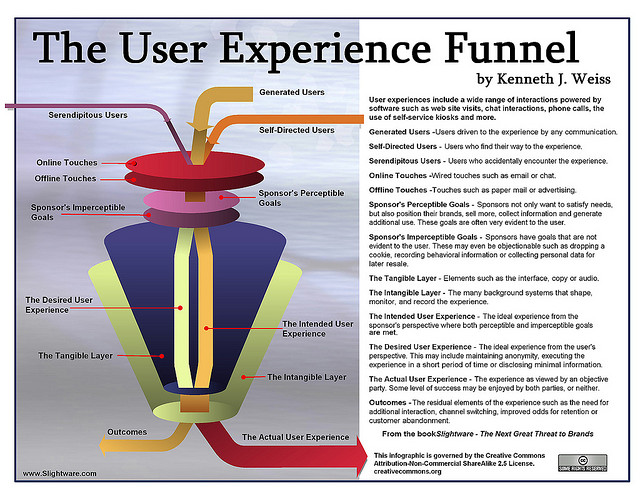
What is it? In the real world, funnels are used to channel a large quantity of something into a narrow opening. Funnels in infographics play off the same idea, with many different concepts depicted above the tunnel coming together to form one unified concept at the narrow end of the funnel.
Best Use: Funnel infographics can show how different “ingredients” come together to create one product or idea, like different types of marketing that work together to increase sales.
Parameter Ruler
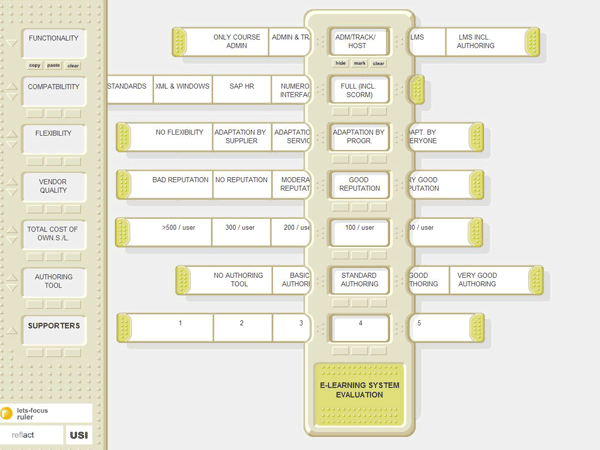
What is it? Parameter rulers are based on the concept of a slide rule, which allow users to move rows to see two or more data points side by side.
Best Use: Parameter ruler infographics can show various alternatives and different combinations of factors. Interactive parameter ruler infographics actually allow users to adjust different rows in order to compare different combinations in a vertical column.
Iceberg
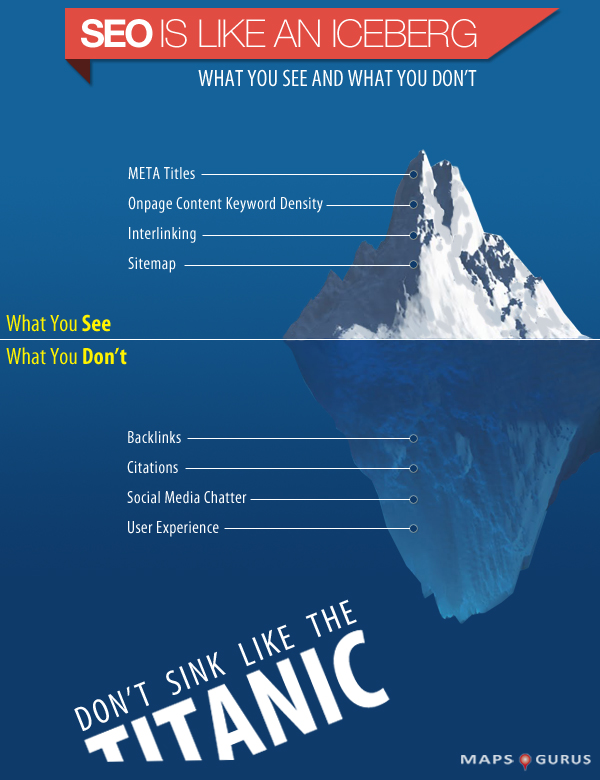
What is it? Iceberg metaphors operate off the idea that part of an iceberg is visible above water while the rest is underwater. Data is divided into above and below categories.
Best Use: An iceberg infographic may be used to show certain things that have succeeded in comparison to other things in the same category that have failed, such as start-ups that have taken off and start-ups that have tanked in the past year. It can also be used to show visible processes vs. behind-the-scene processes, such as a store’s grand opening vs. the work that leads up to that grand opening.
Heaven n’ Hell Chart
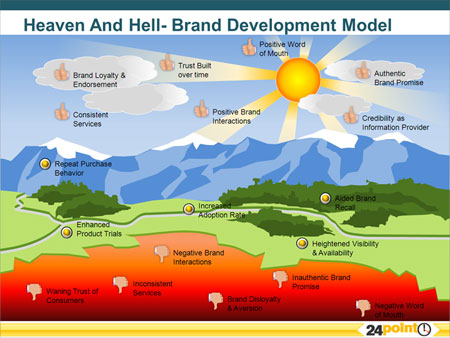
What is it? A heaven n’ hell chart plays on the dichotomy of good and evil, where components with positive associations are depicted at the “sunny” top of the chart (heaven) and components with negative associations depicted at the “fiery” bottom of the chart (hell). Sometimes, components that have mixed positive and negative associations will be depicted in the middle of the chart (earth).
Best Use: Heaven n’ hell charts can be useful in depicting pros and cons (e.g. the pros and cons of retailers offering international shipping).
Hopefully the above examples have given you some ideas about how to use metaphors in your own creations. In the next (and final) part of this series, I’ll look at how you can apply compound visualization methods to your infographics.